


Molekule is a science-based company, which means we look to well-established scientific methods when developing our products. This is necessary for our company because we are reinventing air purification, so measuring the positive effects that our products have on air pollution require instruments at the forefront of science.
During one of our recent rounds of testing on Molekule Air and Molekule Air Mini at the Nationally Recognized Testing Laboratory Intertek, we challenged our purifiers with a few different pollutants and compared the results from different measuring devices. Intertek used the standard laboratory equipment common in research labs around the world, then compared the results with a device more suited for field technicians rather than researchers, and a new technique only developed in the last few years but based on the current standards. While the results were not surprising, it served as further validation of the laboratory techniques we currently use and presented an opportunity to use a new device in the future.
Different techniques and different pollutants
For this experiment we looked at how PECO can destroy three volatile organic compounds (VOCs) that are representative of common household pollutants– d-limonene, toluene, and formaldehyde. All three are classified as volatile organic compounds (VOCs) and each one has slightly different properties. D-limonene is the smell of lemons and oranges and is used in cleaning products, and can cause skin allergies or react with other pollutants to become more dangerous. Toluene is a solvent that is sometimes included in paints and glues and can cause depression of the central nervous systems and other problems. Formaldehyde is known to off-gas from furniture, building products, new clothing, carpets, and other sources, and is a carcinogen.
Intertek also used three different methods of detecting what is in the air:
- Thermal desorption gas chromatography/ mass spectrometry (TD-GC/MS) combined with high performance liquid chromatography (HPLC). This is the current gold standard of laboratory practices. Many research labs that identify VOCs in the air use this technique. It requires taking a sample of air and then analyzing that sample separately from the experiment. The equipment required can cost hundreds of thousands of dollars and requires an experienced researcher. For this experiment we used GC/MS to detect toluene and limonene, then used HPLC to detect formaldehyde.
- A Photoionization detector (PID). This device is commonly used by technicians such as health and safety inspectors to get an idea of VOC contamination in the field. These devices are not complicated and their basic use can be learned in an hour or less. A PID is a small hand-held device that takes continuous readings. They typically cost around five to ten thousand dollars. A PID technique cannot discern between different chemical pollutants, it can only measure their total concentration in the air, and different models of PIDs are sensitive to different ranges of VOCs.
- Selected-ion flow-tube mass spectrometry (SIFT-MS). While the theory for this technique is not new, it’s only been recently that these devices have been available outside of specialized labs. SIFT-MS has the accuracy of TD-GC/MS and HPLC, but can take continuous readings every few seconds instead of having to take air samples from the experiment for later analysis. This equipment costs almost half a million dollars.
All of this equipment must be properly calibrated before use. Typically a researcher uses a pure sample of a well-known VOC to ensure each device is working properly.
Experimental Set-up
For this research the team at Intertek used a 30 cubic meter chamber stainless steel chamber, pictured below. The chambers are sealed to prevent contamination and kept at a constant temperature and humidity.

Air and Air Mini in the chamber with fan and PID (Mini only)
VOC testing was done on two Molekule devices—Molekule Air and Molekule Air Mini. You can see in the picture above that the PID was only used during the Air Mini test. Both devices were tested using the same basic method. First the VOCs were injected into the chamber. The mixing fans you can see behind the units were then activated for one hour to allow the VOCs to even distribute throughout the chamber. Then the units were activated and allowed to run for eight hours.
Samples for the GC/MS with HPLC were taken every five minutes for the first hour and every hour after that. The SIFT-MS and PID were just allowed to gather data, which was stored for later analysis.
Two VOC challenges were levied at the devices, the first was a cocktail of formaldehyde, toluene, and d-limonene. The second was an equal amount of formaldehyde without the other two. This is because photocatalytic devices from decades past have been suspected of producing formaldehyde during their oxidation process, so for this experiment we can compare the formaldehyde-only test to the cocktail test and know if there is any extra formaldehyde produced by PECO.
What we learned
The data gleaned from these experiments was fascinating. We learned about how the three different instruments compare, how we can’t detect any extra formaldehyde during PECO’s operation, and how our two different devices compare to each other.
Molekule Air versus Molekule Air Mini
Both Molekule Air and Molekule Air Mini use PECO to destroy VOCs. Mini is rated for smaller rooms sized 250 square feet while Air is rated for rooms 600 square feet in size. We were able to really see what that means for VOC destruction.

When removing toluene, Air and Mini seem to have fairly similar performance, though Mini looks ever so slightly slower. Both remove half the toluene within 30 minutes.
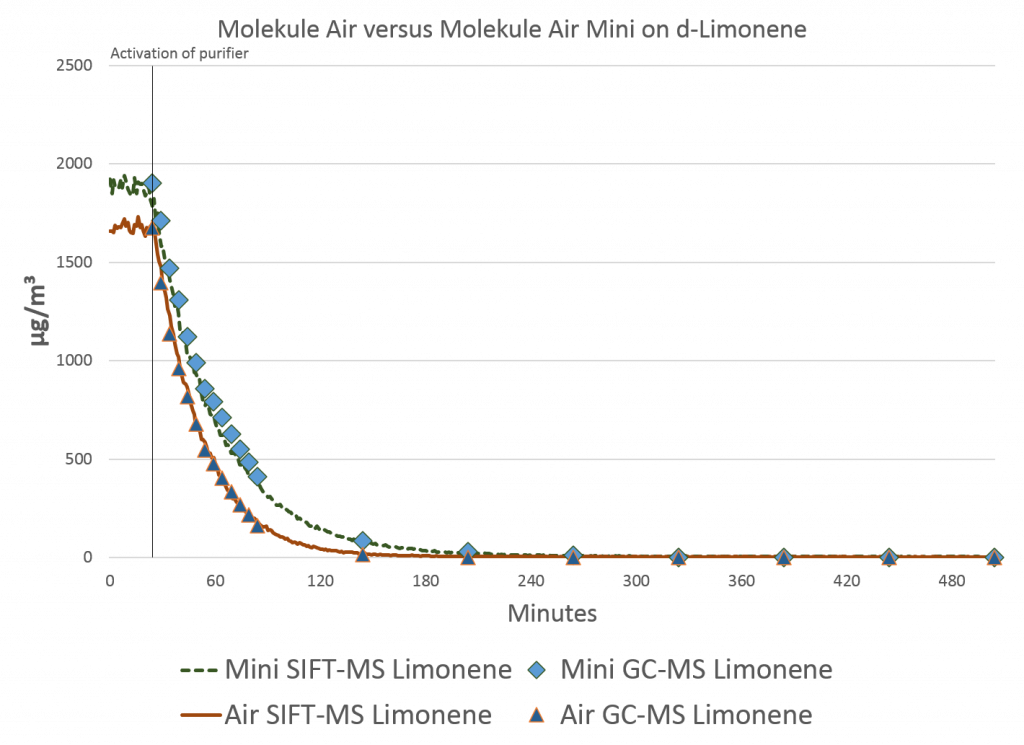
We see a similar effect with d-limonene, though both devices remove it faster than toluene. The levels of limonene for Mini were a little higher at the start so it’s more difficult to tell, but for the most part, the two devices have roughly equal ability to remove it. In the first 30 minutes of operation, both reduced the concentrations by more than half.

There is a different story with formaldehyde. With this VOC it’s clear that Air has an advantage over Mini and was able to remove more formaldehyde during the same period of operation.
GC/MS with HPLC versus SIFT-MS versus PID
When we used the PID during the Air Mini experiments, we found that it can detect d-limonene and toluene, but has a little difficulty with formaldehyde. SIFT-MS and GC/MS with HPLC, however, could detect all three chemicals easily.
Please note that the PID TVOC lines in the graphs below do not have the same units as the other measurements—they are in parts per billion (ppb) rather than micrograms per square meter (µg/m³). As a result, the PID data can only be interpreted for its sensitivity, not its magnitude.

This is a graph of the data from the cocktail test for Air Mini. It’s a little hard to decipher, but basically both the SIFT-MS and GC/MS with HPLC show toluene and limonene approaching zero within 2-3 hours, and formaldehyde concentrations slowly decreasing over time. The PID (line with long dashes) tracks nicely with the toluene and limonene but doesn’t seem to pick up the formaldehyde. This is more obvious in the formaldehyde-only test in this next graph.

Here you can see that the SIFT-MS and HPLC track very closely to each other. However, the PID does not seem capable of detecting much formaldehyde and in fact reports a zero concentration when the other two devices show a relatively high concentration in the chamber.
Our conclusion can only be that the PID we are using not only has the drawback of only displaying total VOC concentration instead of isolating individual pollutants, but also can’t detect formaldehyde well. Another conclusion is that SIFT-MS is an impressive tool. It was able to take many more measurements compared to GC/MS with HPLC and they both detected very similar concentrations decreasing at very similar rates.
Formaldehyde alone versus a VOC cocktail
Another comparison this experiment can show us is if any extra formaldehyde was produced during PECO’s operation. The same amount of formaldehyde was injected for both the cocktail and formaldehyde-only experiments. Below are two graphs showing us what happened.

First, here we have Air Mini’s results. For both SIFT-MS and HPLC, the results are virtually identical and the lines are on top of each other. Not only does this show how well-calibrated the two devices are, it also shows that no detectable additional formaldehyde was produced when PECO was removing toluene and limonene. These results also indicate that PECO is not slowed down in the presence of multiple VOCs.

There is the same effect with Molekule Air. While there is a little more experimental error in this test, neither SIFT-MS nor HPLC detected more formaldehyde while PECO was removing other VOCs in addition to formaldehyde. As with Air Mini, there is no detectable additional formaldehyde produced during operation.
Conclusions
After running these experiments our team was able to find out some key pieces of information about our products and different instruments:
- More evidence that PECO does not produce formaldehyde as a byproduct
- More evidence that the presence of multiple VOCs doesn’t slow PECO down
- The PID isn’t very sensitive to formaldehyde
- SIFT-MS is a compelling new technique that can supply more data over the same period of time compared to TD-GC/MS with HPLC
- Molekule Air is a little faster at removing formaldehyde, likely due to its larger size
You can see the full reports from Intertek and other labs on our papers page.
VOCs are just one slice of air quality, so we will continue to work with Intertek and other labs to use similar cutting-edge techniques to detect how the air is cleaned when our devices are running. Check out this blog for more information on the different tests we run on our products.