


For the past few years, wildfires have been increasing in North America, costing the US government around $3 billion each year. Officials in Northern California are preparing for fires year-round instead of focusing on a single fire season in the fall. Those of us who live in areas where fire is common are all too well aware of the smoke that drifts for hundreds of miles and impacts our comfort and health. We stay indoors, we wear N95 masks, we avoid strenuous activity, and we keep an eye on news and websites.
However, there are many different sources of information and it can be hard to tell exactly how bad the air is and what we should do. Airnow.gov is a site provided by the EPA to provide the Air Quality Index (AQI) and color-coded hazard level for any area. PurpleAir is a company that provides a map of the readings from their low-cost sensors. Then the National Weather Service has their own map, and the local news may have some opinions as well. Finally we all have our own noses and eyes that might tell us something else entirely.
The AQI is a very useful tool to get an indicator of how dangerous it could be to breathe the air. Exactly how dangerous is difficult to determine because everyone is different, but the environmental research group Berkeley Earth came up with a way to think about AQI by comparing the number of people who die from cigarettes with those who die from air pollution. They estimate breathing 22 micrograms per cubic meter of PM2.5 for 24 hours is equivalently lethal to smoking one cigarette. If we compare that to the AQI, it roughly shakes out to the following:

This means that once the AQI gets into the orange range, your lungs are taking as much damage as someone who smokes two cigarettes every day. In the purple range, you’re up to half a pack. Knowing the AQI can be important for our health. Below, we have laid out some common contradictions in air quality and what you should expect from each source.
When the sky is orange but the air quality is green
During the California wildfires in early September 2020, as the sun rose residents in the San Francisco Bay Area were greeted with an orange haze coloring the sky.

When the picture above was taken, the AQI on Airnow sat at about 60, which is in the yellow moderate range but very close to the green good range. Residents were confused as to how this could be possible.
San Francisco sits on the Pacific coast where an ocean breeze continuously drifts in. As a result the air over the land in this region is cool and dense. The smoke seen in this picture comes from wildfires hundreds of miles to the north and south, and is carried by wind currents warmer than ocean air. Fortunately for the residents of San Francisco, the layer of hot polluted air floats above the layer of cool ocean air, which is cleaner.
This concept is known as a marine layer or an inversion layer, and often prevents air near the ground from mixing with air higher in the atmosphere. Inversion layers don’t always keep smoke off the ground, sometimes these stationary layers of air can trap pollutants. In places like Salt Lake City and Los Angeles County, inversion layers frequently develop and have been causing bad air days for hundreds or even thousands of years. Even before the advent of the automobile, smoke from villages could accumulate in the denser cool air and become trapped, unable to rise through the warm layer above.
Once the sun is able to warm the ground and the ocean air, the layers will mix again. A day after the picture above was taken the AQI in the Bay Area went over 200 for almost a week.
When the AQI is good but the air smells bad
The EPA site AirNow.gov primarily seeks to keep the public informed about the National Ambient Air Quality Standards (NAAQS) which were established as part of the Clean Air Act of 1990. These standards provide guidance for safe levels of carbon monoxide, lead, nitrogen dioxide, sulfur dioxide, ozone, and two sizes of particulate matter. Always keep in mind that while these criteria pollutants are usually correlated with total pollution levels, they don’t tell the whole story.
One important type of pollutant left out of the NAAQS conversation is VOCs or hydrocarbons. These substances enter the environment from burning fossil fuels or other organic matter. The smell of wildfire is typically the VOCs released from trees burning such as acetic acid, benzene, toluene, formaldehyde, furan, and many others. If you smell smoke but the AQI is in the green, then you may be smelling the VOCs from that smoke. The VOCs your nose is telling you about can interact with ozone to produce more dangerous air pollutants. If you smell smoke, it’s a good idea to stay indoors and run a purifier to help keep the air clean.
Another recent air quality issue we are all familiar with is Covid-19. While it is unclear to exactly what degree the virus spreads in the air, many scientists agree that aerosolized droplets are a route of transmission. SARS-CoV-2, the virus that causes Covid-19, is a biological particle and thus not detected by the EPA AQ sensors in any meaningful way. The same is true for pollen, mold, bacteria, or any other biologically active substance.
While the current EPA methods may leave out important pollutants such as VOCs and microbes, the criteria pollutant guidelines are backed by firm science and can be relied on to give an accurate picture of when the air quality is bad. If AirNow.gov is reporting bad air quality in your area, follow their recommendations.
One more reason the EPA sensors might not agree with your nose is due to time delay. The EPA sensors report an average AQI over the past 24 hours, so if conditions change quickly dangerous air quality may not be reported right away. Trust your gut, if it smells bad stay indoors.
When sites disagree
EPA sensors follow the Federal Reference Method (FRM) or Federal Equivalence Method (FEM) which are complex scientific standards. They use sensors that cost tens of thousands of dollars and require specialized technicians and equipment. Their findings are approved by multiple layers of experts. Typically these sensors capture particles on a special filter that is then very accurately weighed to determine the amount of particle pollution it holds.
Purple Air sensors, on the other hand, are more simple devices that cost about $250 and use a simple laser-based system to estimate the volume of particles in the air. If the owner of the Purple Air sensor desires so, the data from their Purple Air sensor can be displayed on Purple Air’s map of air quality. While they don’t have the regulatory checks and balances of the EPA system, these cheap devices can still offer information on local air quality, particularly when many are in operation.
The Purple Air system has a drawback in that the density of the particles has to be estimated and wood smoke particles are a little less dense than average particle pollution. The EPA estimates that specifically during wood fire smoke events like wildfires, Purple Air may overestimate the presence of particles by as much as 60%.
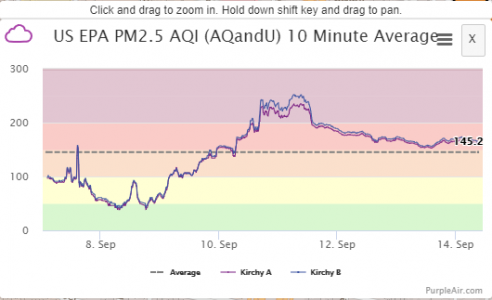
The Lane Regional Air Protection Agency, located in Oregon (LRAPA), has done some testing on Purple Air sensors and found them to be about twice as sensitive as the EPA system. Purple Air has integrated this into their Map, and at the lower right you can select the “LRAPA” conversion factor which can correct the AQI number. The University of Utah has also examined Purple Air sensors and developed their own conversion factor, AQandU, which can also be selected on the Purple Air map. As of September 14th, 2020, the EPA recommends AQandU when the AQI is over 150.

EPA sensors were reporting an AQI of 198 during the time the screenshots above were taken. Always keep in mind that PurpleAir is averaged over 10 minutes and the EPA information is averaged over 24 hours, so the EPA AQI will shift more slowly and is usually affected by any highs or lows over the previous day.
A benefit of the Purple Air sensors is being able to see air quality data over time. On the map you can click any sensor and see its trend of air quality. Regardless of the accuracy compared to other systems, trend data is valuable to see how conditions have changed over time.
If AirNow.gov has one major drawback, it is that it only reports the average over a whole region. So all of the sensors in a given area will be reporting the same number. This can cause accuracy issues if one area is across water or in a microclimate with different wind patterns. So while all of the sensor information available to us is valuable, keep in mind that all information comes with caveats.
The EPA also has a third site, Fire.AirNow.gov, that integrates PurpleAir and Air Now sensors. While there are no correction factors mentioned, the historical data from both the PurpleAir sensors and the permanent EPA sensors is available with a click.
Take charge of your indoor air quality
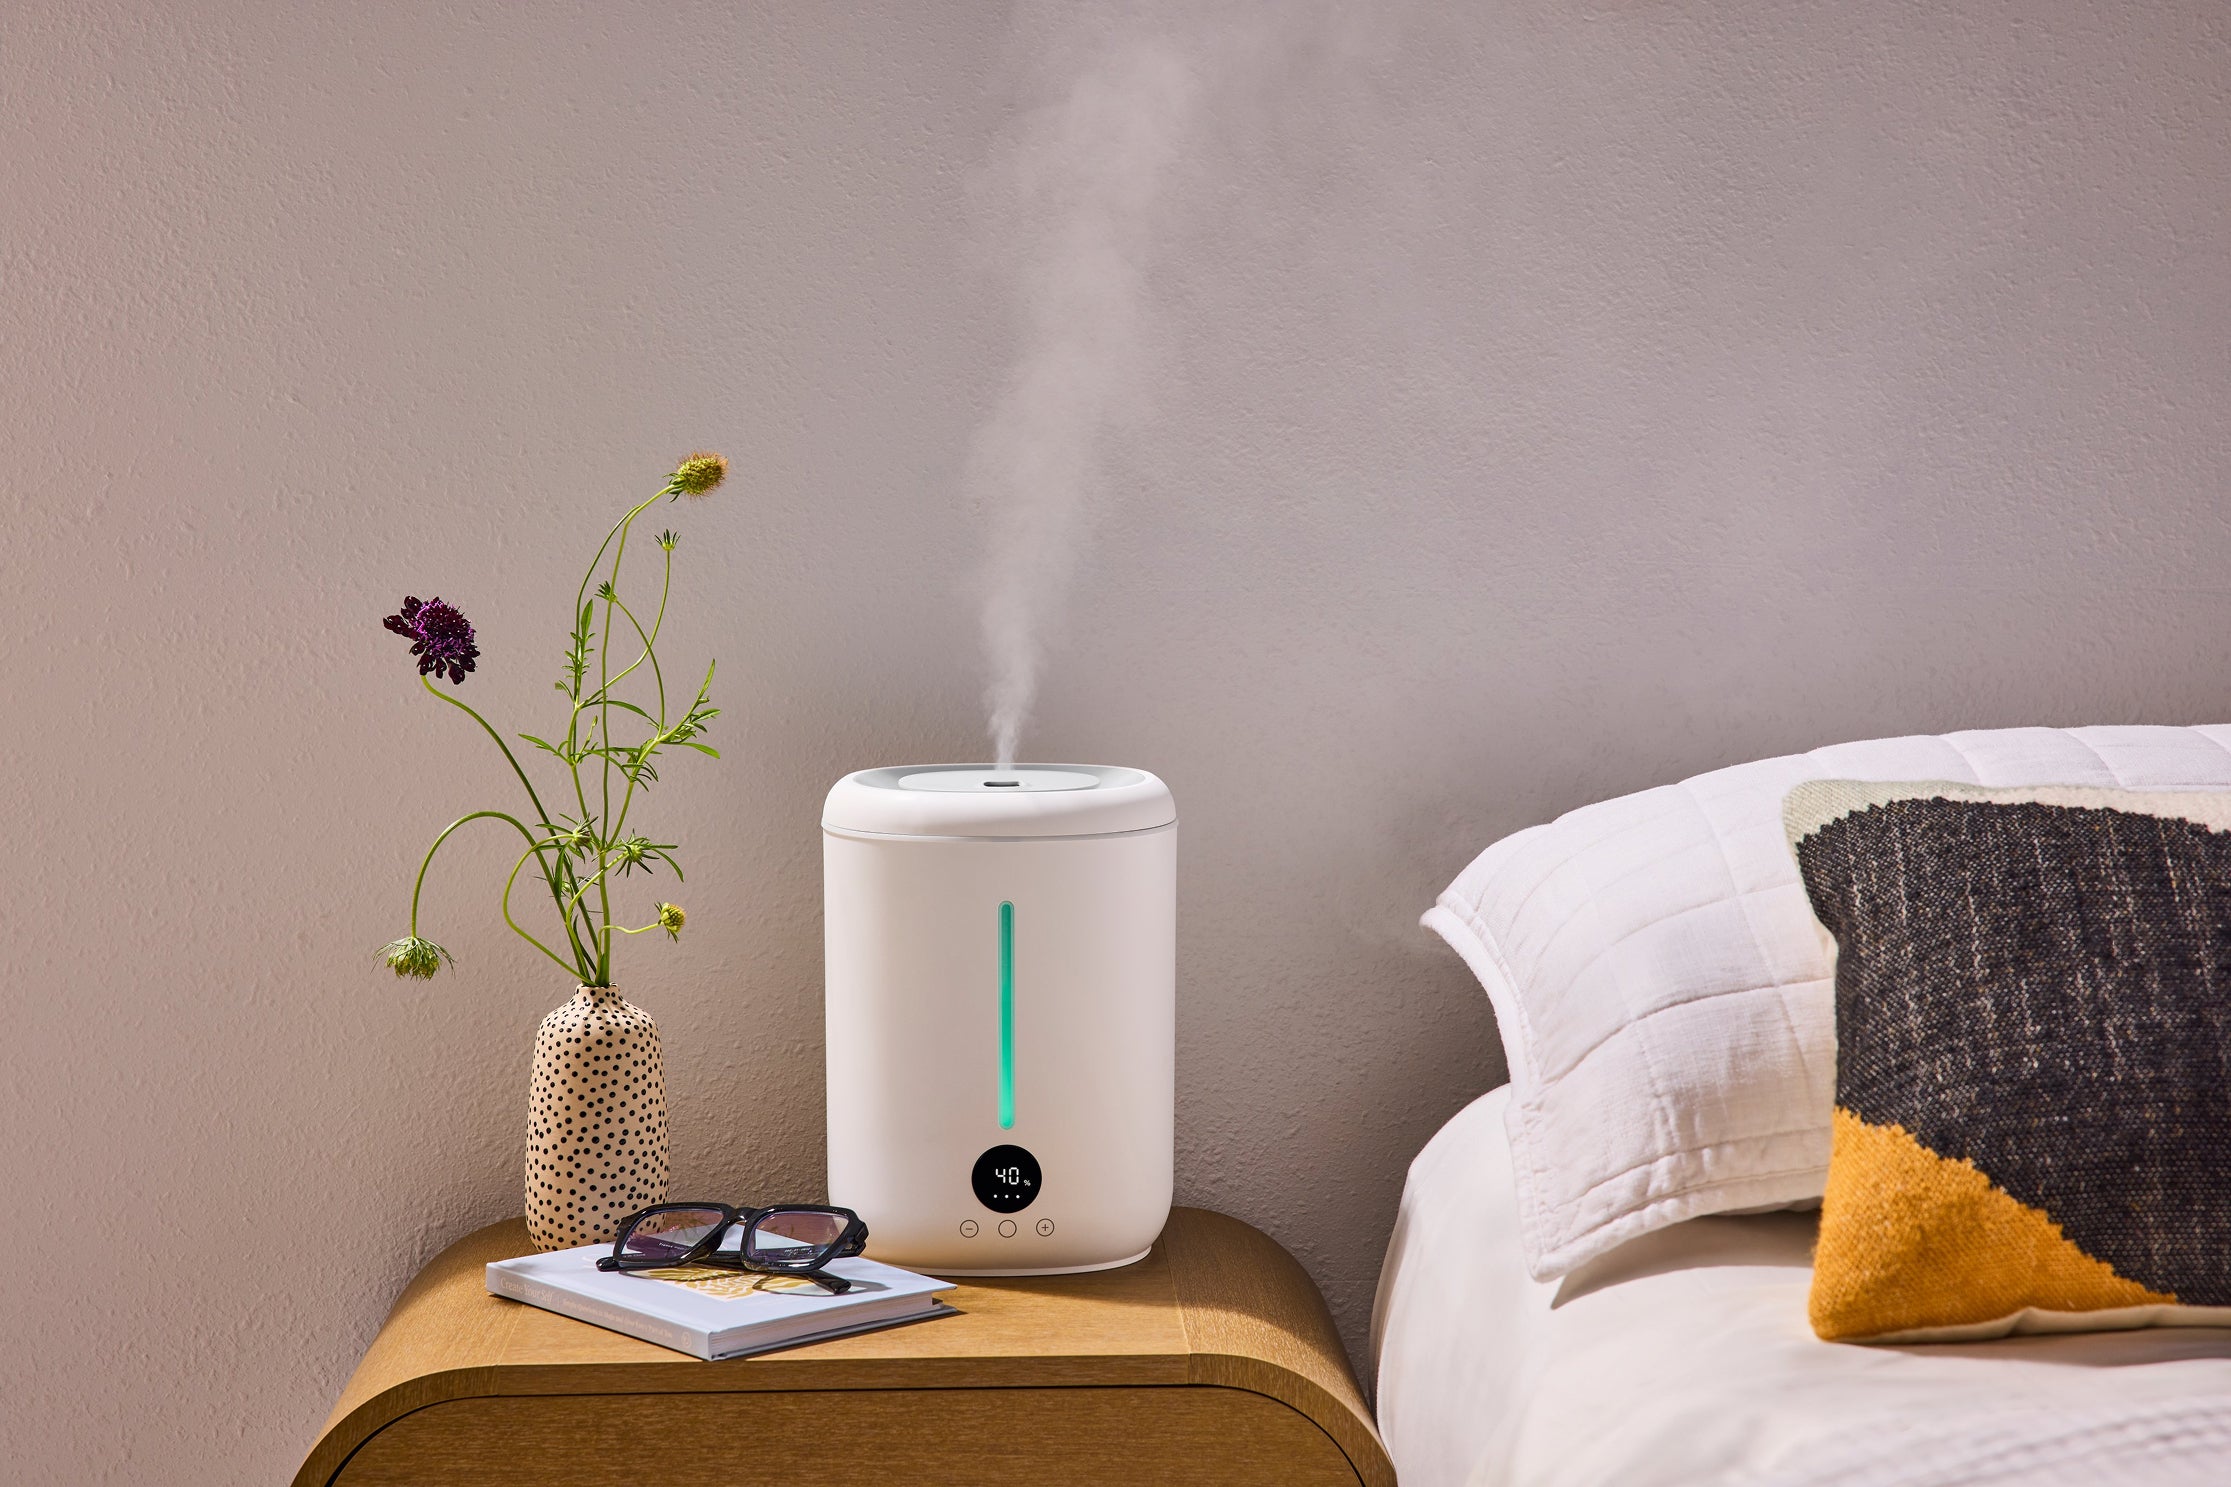
Unless you take steps to mitigate the pollution, the AQI in your home will be reflective of what it is outside. Fortunately there are a few things you can do to reduce your risk of exposure to air pollution in your home.
Before you even start tackling indoor air quality, get an indoor air quality sensor. There are a wide variety available, and they can tell you what the AQI is inside your home or at least if it’s gotten worse or better. These can be useful even when there isn’t a wildfire nearby to let you know if your air has gotten bad from particles generated by cooking, cleaning, or any other reason.
If you’re experiencing household air pollution, try sealing your windows. There are a variety of ways to do this. You can caulk the windows of your home to stop any obvious gaps. If the gaps aren’t obvious then weather sealing tape around the perimeter of the window can also serve to seal it off from the outside. If it’s an option, replace any doors to the outside that have gaps underneath or around the edges.
Finally, you can seek a way to filter particles from your indoor air. One option is to upgrade your furnace filter to at least a MERV 13 filter. The blowers in most HVAC systems aren’t really designed to clean the air, just maintain temperature, so some filters are a little too much for some systems to handle. If you decide to upgrade your filter first ask a technician if your system can still effectively move air. Regardless, change your filter according to the manufacturer’s recommendations to ensure it’s as efficient as possible.
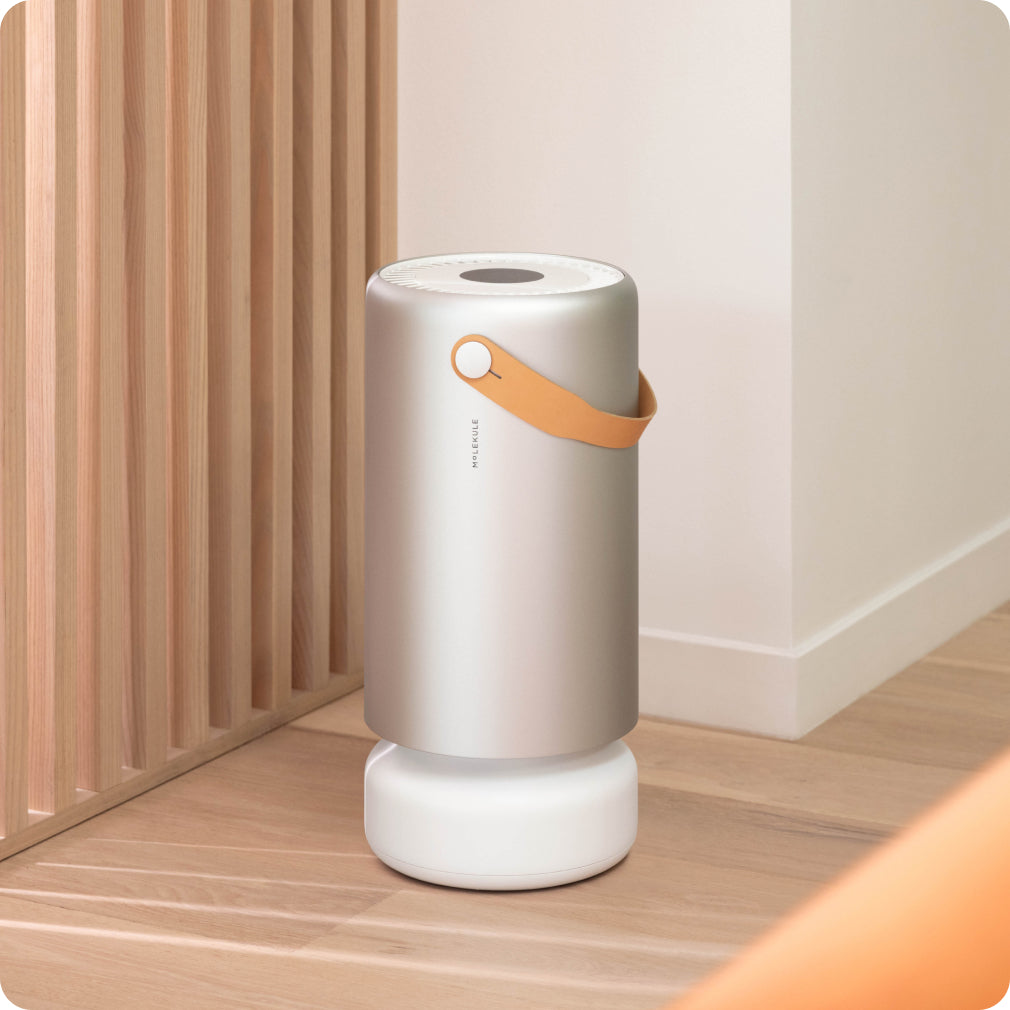
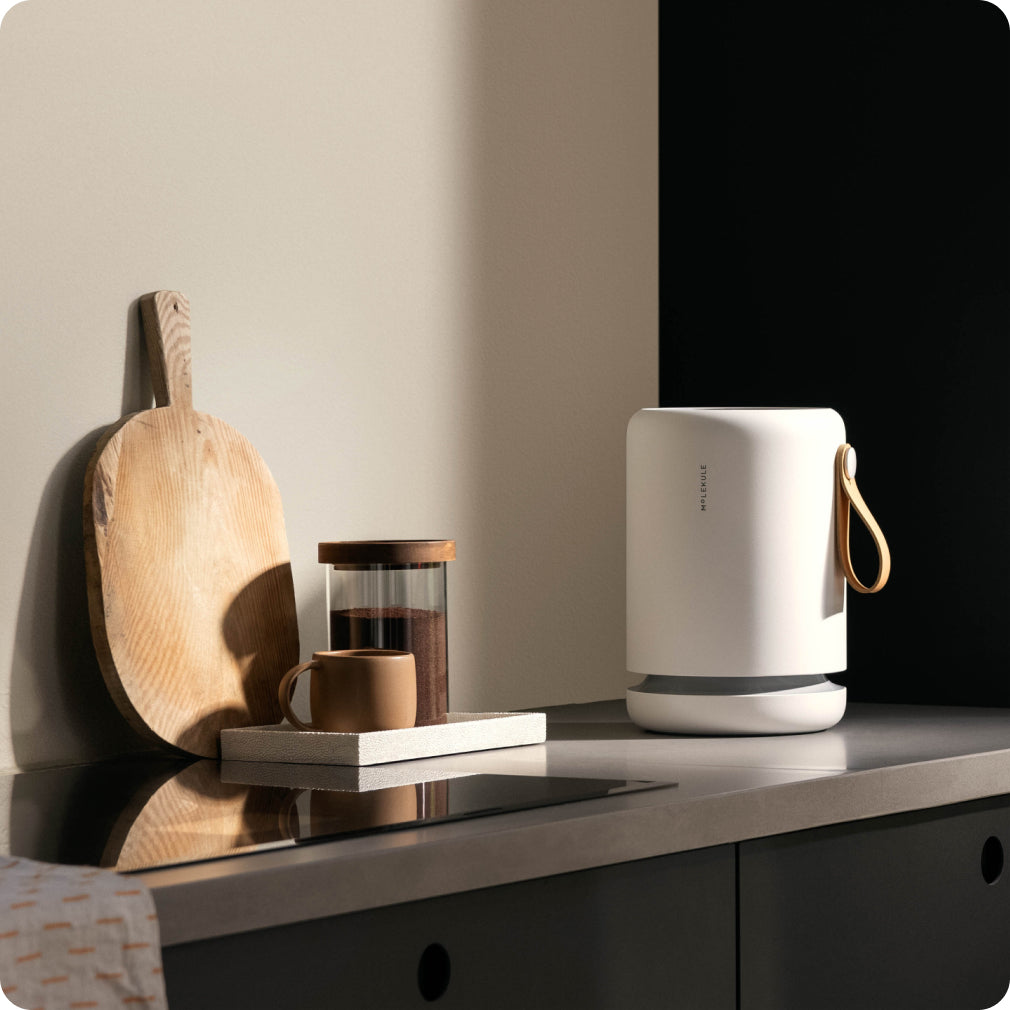
You can also get a portable air purifier to place in any occupied room, then close any doors to create a cleaner space. Be sure the purifier is rated to clean enough square footage, and also that it has a method of dealing with VOCs in addition to particle pollution. Just like the furnace filter, change the filter on time to ensure it stays at maximum efficiency. Old filters can be full of toxins or just clogged up which can impair how well they clean the air.
The frequency of wildfires doesn’t seem to be slowing down at all. They can affect asthma and allergies, in addition to impacting your health in other ways, so stay tuned to this blog to learn more about them and how to keep yourself safe.