
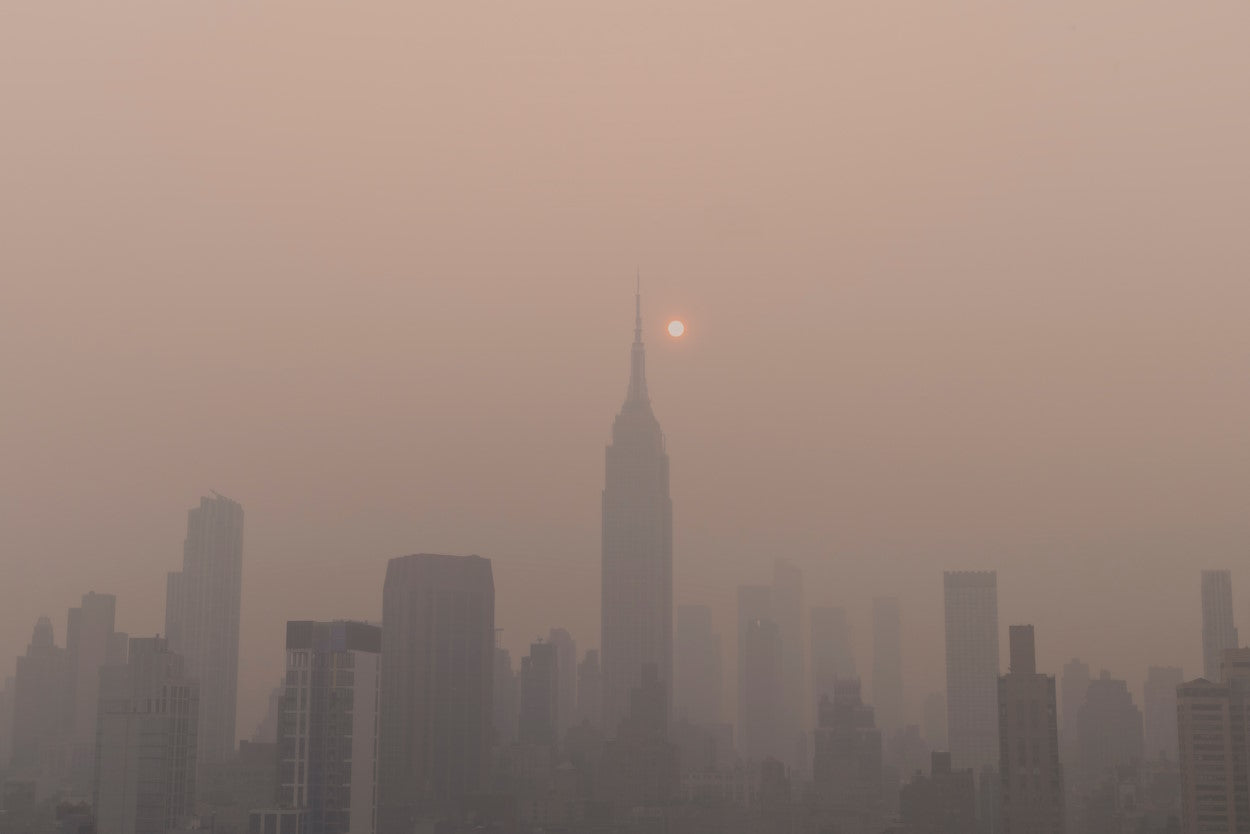

Raging wildfires in Canada blanketed much of the middle parts of North America with dense wildfire smoke for most of June. The AQI in some parts of New York City exceeded 400 on June 7th, and the whole Metropolitan Area of 20 million people was impacted by bad air quality. There are many thousand Molekule Air Pro purifiers among this massive population, and so we were able to learn about indoor air quality in the region during this extreme outdoor air quality hazard.
We are also fortunate to have access to the sensor data that the EPA makes available to the public, so we are able to make apples-to-apples comparisons between outdoor air quality and the air inside the homes of Molekule customers. We don’t know what the air was like in homes without an Air Pro. In times of extreme outdoor air pollution, indoor air will be significantly cleaner, but this data is still helpful to demonstrate what kind of air quality you can expect in a home with a Molekule.
Please note that the EPA’s air quality index is a 24-hour time-weighted average. For the purposes of this article, a 1-hour time-weighted average from Molekule air purifiers was used to gauge the indoor air quality index in an approximation of the EPA’s AQI. Whenever we look at data from Molekule air purifiers for this kind of analysis, it is always in total or as an average, we never analyze or share any individual’s information without their permission. Our privacy policy can be reviewed on our website.
An Extra Layer of Protection in New York City
There are 857 Air Pros in New York City that we were able to take a look at. They’re distributed across the 5 Boroughs but are concentrated mostly in Manhattan, as you can see here.

EPA Monitoring stations are also well distributed throughout New York City and concentrated in Manhattan as you can see here in this image from AirNow.gov.

We narrowed down the EPA data to the New York City Region and compared it against the same ZIP codes that had Air Pros. As you can see below, we saw that Air Pro did a great job of protecting against the highest peaks of wildfire air pollution.

Even as the air quality worsened outdoors, the air quality of people with Molekule Air Pros stayed almost the same.
Grabbing Smoke out of the Air in Connecticut
We were also able to look at 373 Air Pro purifiers spread across the state of Connecticut and compare them to the EPA sensors. Please note that the magnitude of these results could be a little off without the same large metropolitan area-specific targeting.

Each time the air quality got a little worse in Connecticut there was a corresponding increase in particle counts, but on average the indoor air quality in the homes of Molekule owners stayed in the moderate range.
Automatically Responding to Air Quality Changes in Pennsylvania
There were 1,322 Air Pros throughout Pennsylvania, which was extremely close to the fires. EPA monitors during the June 6th to June 8th period recorded a peak AQI of 429, which means many places in Pennsylvania were even worse.

Molekule owners in Pennsylvania enjoyed very good indoor air quality while the rest of the state was inundated with smoke and toxic gasses.
Avoid Breathing Particulate Matter
Particles from any source are unhealthy to breathe, and smoke from wildfire has often had time to travel through the atmosphere for a while and pick up nasty additions like VOCs and free radicals. The EPA provides us with the air quality index or AQI, which can help to let us know when air pollution might be too bad to go out. In the graph below of the AQI versus the concentration of particles, you can see the EPA’s AQI color-coded scale. The degree of air hazard changes quickly with small amounts of particles that can harm people with sensitive respiratory systems.

We have also included a measure of a rough equivalence to the number of cigarettes with regard to cancer risk for each AQI band, if that concentration were breathed for 24 hours. You can see that just one cigarette is the same as breathing moderately bad air all day, and a whole pack is like breathing the worst air quality on the scale all day.
This is just the start of the information we have to offer, so keep an eye on this blog and our Facebook, Instagram, and Twitter accounts for the most up to date take on what’s happening in your air.
Photo of New York City skyline with wildfire smoke by Ahmer Kalam on Unsplash